Proceeds from the ads below will be donated to the
Bob Wuesthoff scholarship fund.
Thursday, September 02, 2004 |
More On Postseason Probabilities
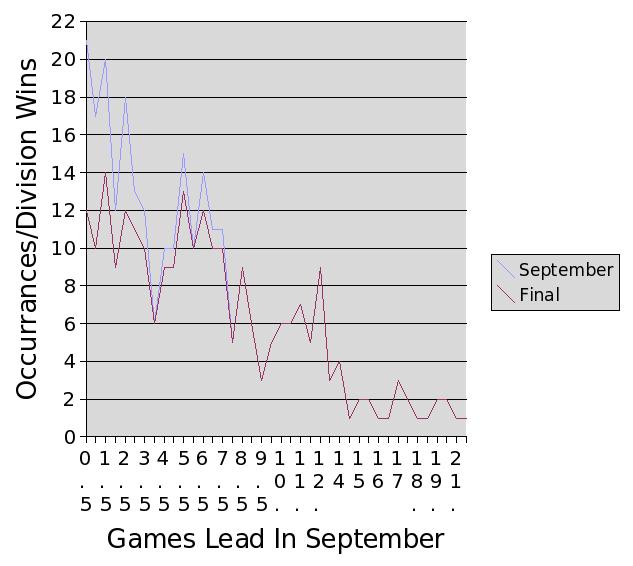
Here's a nifty graph I just built indicating the historical occurrances of winning your division with a particular lead:

The blue line represents the number of teams that have had a particular lead going into September, while the purple line represents the number of teams that actually converted those to division or league (in the case of teams prior to 1969) wins. As you can see, moving from the left, anything under three games is a crapshoot, while anything three games or over is pretty much a lock. No team has ever blown a lead of eight or more games.
Newer› ‹Older

Post a Comment
Note: Only a member of this blog may post a comment.